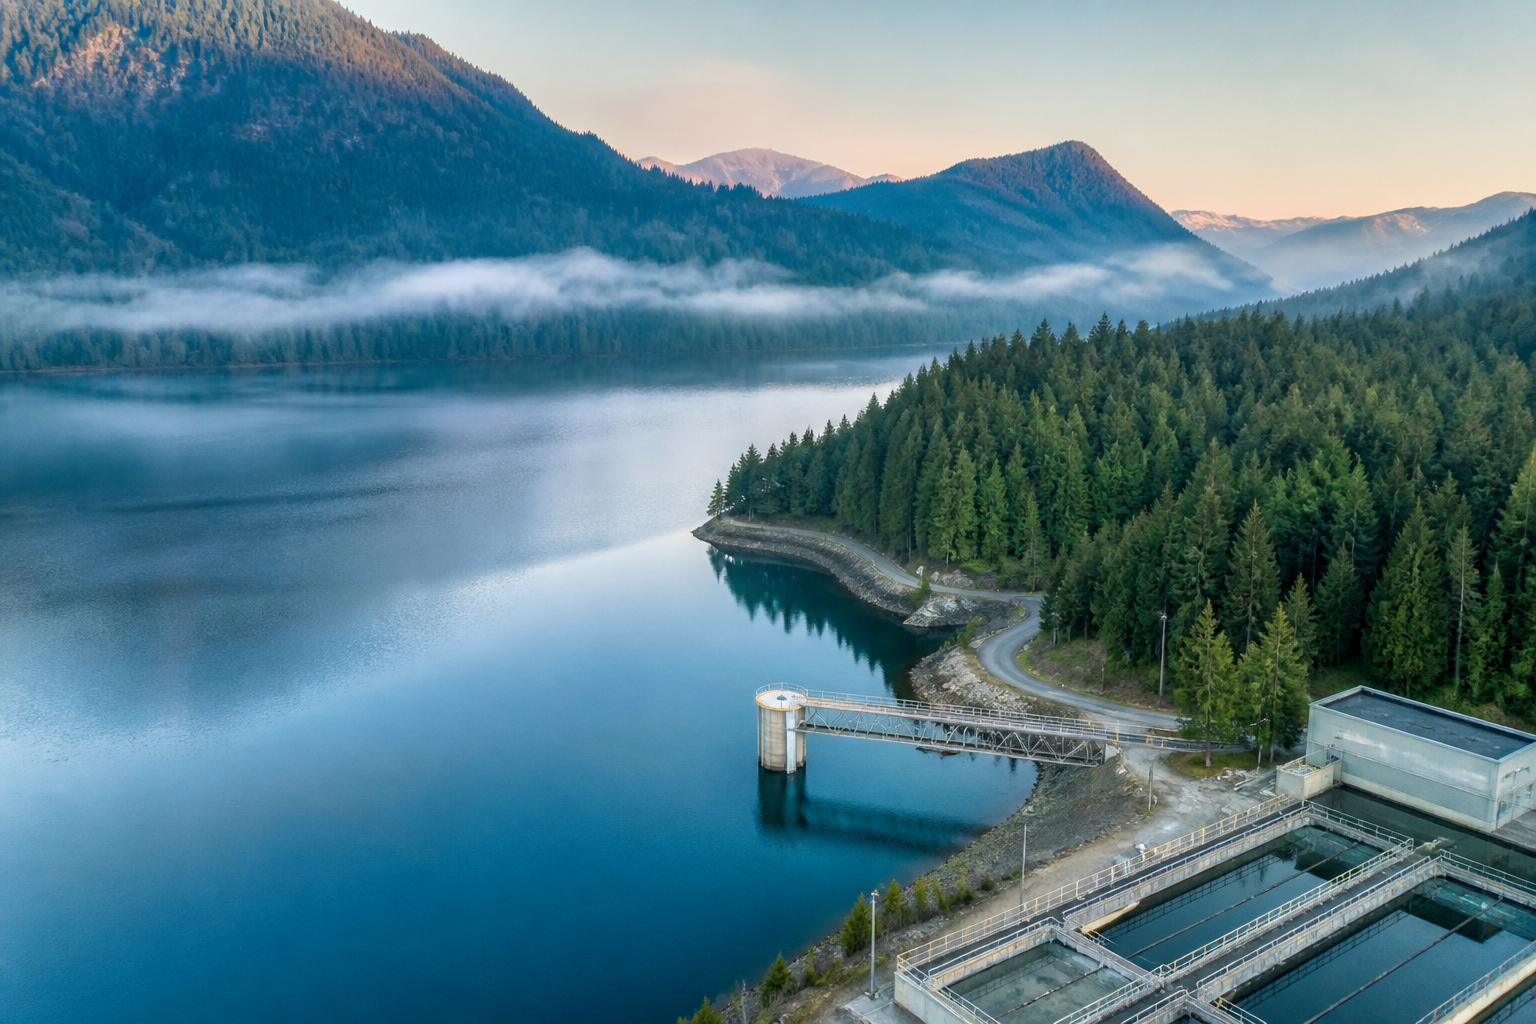
Drinking Water Quality and Supply

Drinking Water

Water Quality

Municipal drinking water for Canadian cities: hardness, pH, lead, fluoride, and chlorine graded against Health Canada guidelines, plus where each city draws water and how it is treated.

Coverage

Water Quality and Supply Across Canada

Hardness and chemistry from municipal reports, with source waters, treatment plants, and distribution notes on every city page.

343
Cities tracked
13 provinces and territories
343
Supply profiles
184 surface · 80 groundwater · 79 mixed
175
Cited source links
175 with named source waters
52
Direct municipal tier
291 regional estimates · sync 2026-09-01

Comprehensive supply and treatment research sits alongside the graded chemistry: each city page names how the system draws water, which plants treat it, and how distribution is described in utility publications. Research method · Data sources.

Sponsored

OpenStats picks for Calgary — very hard water (279 mg/L)

Calgary’s 279 mg/L hardness (Grade C on our scale) is softener country — pitchers only polish taste. OpenStats sizes a metered Aquasure Harmony softener for southern Alberta minerals, pairs Waterdrop under-sink carbon for 1.2 mg/L chlorine, and a top-selling shower filter for pool-smell showers.

As an Amazon Associate, OpenStats earns from qualifying purchases.

Sponsored

OpenStats picks for Vancouver — everyday tap water

Metro Vancouver’s 113 mg/L snowmelt supply is soft by Canadian standards — you are filtering for chlorine taste, not minerals. The Denali pitcher is the value pick; step up to under-sink carbon if you cook with lots of filtered water.

As an Amazon Associate, OpenStats earns from qualifying purchases.

Softener guide · Filter guide · Test kits · Hardness guide

Source water

Supply Types

Every city page states whether the municipal system draws surface water, groundwater, or a mix, with named source waters when utilities publish them.

184

Surface water

Rivers, lakes, and reservoirs. Treatment usually includes coagulation, filtration, and disinfection before distribution.

80

Groundwater

Wellfields and aquifers. Often harder mineral content; some systems are GUDI (groundwater under the direct influence of surface water).

  • Amos · Esker Saint-Mathieu–Berry (municipal drains / wells)
  • Charlottetown · Winter River watershed groundwater (municipal wellfields)
  • Chilliwack · Sardis-Vedder Aquifer, Marble Hill Aquifer
79

Mixed surface and groundwater

Utilities that blend lake or river water with wells, or that switch seasonally between sources.

  • Abbotsford · Norrish Creek (Dickson Lake), Cannell Lake
  • Barrie · Lake Simcoe (Kempenfelt Bay), Deep aquifer groundwater wells
  • Cambridge · Groundwater aquifers (Region of Waterloo wells), Grand River

Every city page names source waters where utilities publish them, with links into municipal reports. How to read supply notes.

Treatment

From Plant to Tap

City pages list treatment plants and distribution notes drawn from utility publications.

Municipal systems move water from the source through a treatment plant (or plants), into transmission mains and reservoirs, then into neighbourhood distribution. Plant names and notes on each city page come from the same cited materials as the supply type, not from guessed process flowsheets.

Typical steps include screening or aeration, coagulation and settling where needed, filtration, and disinfection (often free chlorine). Corrosion control and fluoride adjustment appear where the utility practices them. Open a city profile for the plants that serve that municipality.

Browse cities by province · Data sources

Watershed to tap

Supply chain schematic

Reading the numbers

Hardness and Lead

Hardness describes dissolved minerals. Lead is assessed against a Health Canada maximum.

Hardness (mg/L as CaCO₃)

Health Canada does not set a maximum acceptable concentration for hardness. Classes on city pages follow common treatment convention: soft under 60, moderate 60 to 120, hard 120 to 180, very hard above 180. Harder water often means more scale in heaters and less soap lather; it is not a safety score on its own.

  • Soft · under 60 mg/L
  • Moderate · 60 to 120 mg/L
  • Hard · 120 to 180 mg/L
  • Very hard · above 180 mg/L

Example class for a 200 mg/L reading: Very hard. Full hardness primer

Lead (μg/L)

City pages compare lead to Health Canada's maximum acceptable concentration of 5 μg/L. Lead at the tap can differ from the plant outlet when older service lines or premise plumbing contribute. A municipal average is a community signal, not a measurement of your kitchen tap.

Letter grades also weigh pH, fluoride, and free chlorine against guideline ranges. Active advisories override routine parameter reading for immediate safety decisions; see boil water advisories.

Confidence

Data Tiers

Every city page carries a tier badge so you can see whether the hardness and chemistry figures come from a direct municipal report or a regional estimate.

52

Direct municipal data

Parameters taken from that city's or utility's published water quality report. These pages are indexable and preferred for YMYL comparisons.

291

Regional estimate

Best available figure until a direct municipal report is ingested. Pages stay labeled and are not promoted as verified plant lab results. Supply profiles may still name sources and plants from separate research.

Supply-profile research confidence across the atlas: 132 high, 211 medium, 0 low. Details on methodology.

Reading the scale

Water Quality Grade

Letter grades from Health Canada guideline compliance, with hardness and lead compared to provincial averages.

B

Water quality grade

Good

Graded against Health Canada drinking water guidelines

Lead within guidelinepH in range
Hardness vs provincial average106 mg/L · prov. avg 178 mg/L
Lead vs provincial average0.2 μg/L · prov. avg 0.3 μg/L
Hardness
106 mg/L
Lead
0.2 μg/L
≤ 5 μg/L
pH
7.4
6.5–8.5 range

Sample reading from Airdrie, AB. Individual city pages show full parameter tables, supply notes, and provincial comparisons.

City supply profiles

Open a Municipality

Each city page combines the latest graded parameters with supply type, named source waters where published, treatment plant names, and cited utility links. Start from a province list or jump into a supply example above.

Browse by region

Provinces and Territories

Drinking water quality and supply profiles for every tracked municipality

Featured cities

Hardest Water in Our Sample

Highest measured hardness among tracked municipalities with verified or regional estimates

Check Your City

Explore drinking water quality and supply for Canadian cities: hardness, lead, treatment plants, and source type on every page.

Browse all cities